
How to Check Core Web Vitals / Lighthouse Score in Chrome
Before you can improve your site’s performance, you need a reliable way to measure it. Chrome ships with everything you need built in, and a couple of free companion tools fill in the gaps. This guide covers four ways to check your Core Web Vitals and Lighthouse score, plus how to read the results without fooling yourself.
Method 1 — Chrome DevTools Lighthouse panel
This is the fastest way to audit any page you can open in your browser, including local and password-protected sites.
- Open the page you want to test in Chrome.
- Press F12 (or right-click and choose Inspect) to open DevTools.
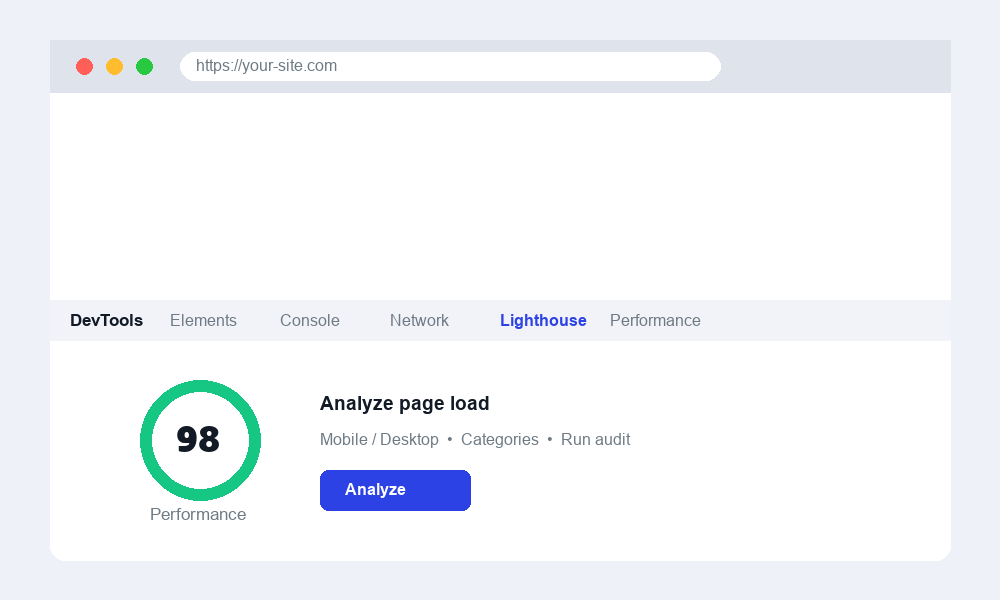
- Click the Lighthouse tab. If you do not see it, click the
>>overflow arrow to find it. - Choose a device mode: Mobile or Desktop. Mobile is stricter and usually the one that matters most for rankings.
- Select the categories you care about, such as Performance, Accessibility, Best Practices, and SEO.
- Click Analyze page load and wait while Lighthouse reloads the page and measures it.
- Read the scores. Each category gets a 0-100 score, and the Performance section breaks down individual metrics like LCP and CLS.
The report also includes an Opportunities and Diagnostics section that lists specific fixes, ranked by how much time each could save. This is the most useful part of the whole report, so do not stop at the headline number.
Method 2 — PageSpeed Insights
PageSpeed Insights runs the same Lighthouse engine but adds something DevTools cannot: real-world data. Visit the PageSpeed Insights website, paste in your public URL, and analyze it.
- Field data appears at the top when available. This is the Chrome User Experience Report, built from anonymized data of real Chrome users who visited your page over the past 28 days. It is the truest measure of how your site actually performs.
- Lab data appears below it. This is a single controlled test run in a simulated environment, useful for debugging because it is repeatable.
Field data only appears once your page has enough real traffic. A brand-new or low-traffic page will show lab data only, which is normal.
Method 3 — The Web Vitals Chrome extension
For continuous, real-time feedback as you browse, install the official Web Vitals extension from the Chrome Web Store. Once enabled, it shows a small badge reporting the live LCP, CLS, and INP values for whatever page you are on. Because INP measures interaction responsiveness, you can click around the page and watch the number update in response to your actions. It is the best tool for spotting which specific interactions feel sluggish.
Method 4 — The Performance panel
When you need to know why a metric is bad rather than just what it is, open the Performance tab in DevTools and record a page load. The resulting timeline shows exactly when the main content painted, which scripts blocked rendering, and where layout shifts occurred. Modern Chrome marks the LCP element and flags layout shifts directly on the timeline, so you can trace a poor score back to the exact resource or element causing it.
Lab data versus field data
Understanding the difference between these two is the key to interpreting any performance report.
- Lab data is a controlled, synthetic test on a single device and connection. It is consistent and great for diagnosing problems, but it is just one machine’s experience.
- Field data is aggregated from thousands of real visitors on every kind of device and network. It is what search engines actually use to assess your page experience.
It is completely normal for a perfect lab score to coexist with mediocre field data, because real users have slower phones and worse connections than your test machine.
Why your scores vary between runs
If you run Lighthouse twice and get different numbers, you are not doing anything wrong. Scores fluctuate because of network conditions, server load, background processes on your computer, and even ad or A/B test variations on the page. To get the most stable, trustworthy results:
- Test in an incognito window so cookies and cached sessions do not skew the result.
- Disable other browser extensions, which inject their own scripts and slow the page down artificially.
- Keep Lighthouse’s built-in throttling enabled so the test simulates a realistic mobile connection rather than your fast office WiFi.
- Close other heavy tabs and applications that compete for CPU.
Tips for accurate testing
- Run each test three times and look at the median rather than trusting a single number.
- Always note whether you tested Mobile or Desktop, since the two scores differ significantly.
- Trust field data over lab data for real-world decisions, but use lab data to find and fix specific issues.
- Re-test after every optimization so you can confirm the change actually helped.
- Test from a clean incognito session with extensions off for the most comparable, repeatable results.
Contributor at WowPixelTheme — sharing tips, tutorials and product updates.